We use only the cookies needed to run the site and keep you signed in. No analytics, no advertising. Your answer covers anything optional we add later.
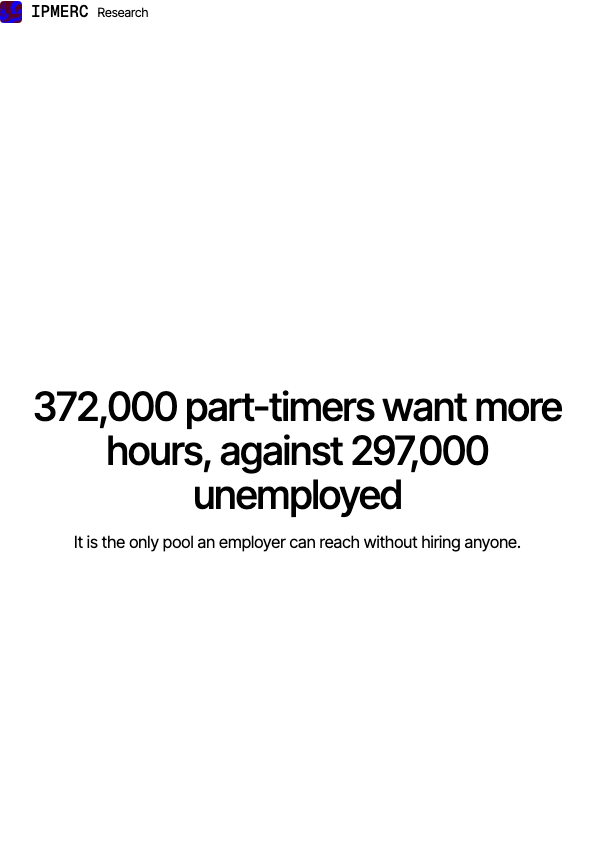
In 2025 the Netherlands counted 372,000 part-timers who want to work more hours, against 297,000 unemployed people. The largest untapped group on the labour market already has a job. Part-timers say they want 2 to 2.5 extra hours a week on average. At a client with twenty part-timers that is more than a full working week, without a single new candidate.
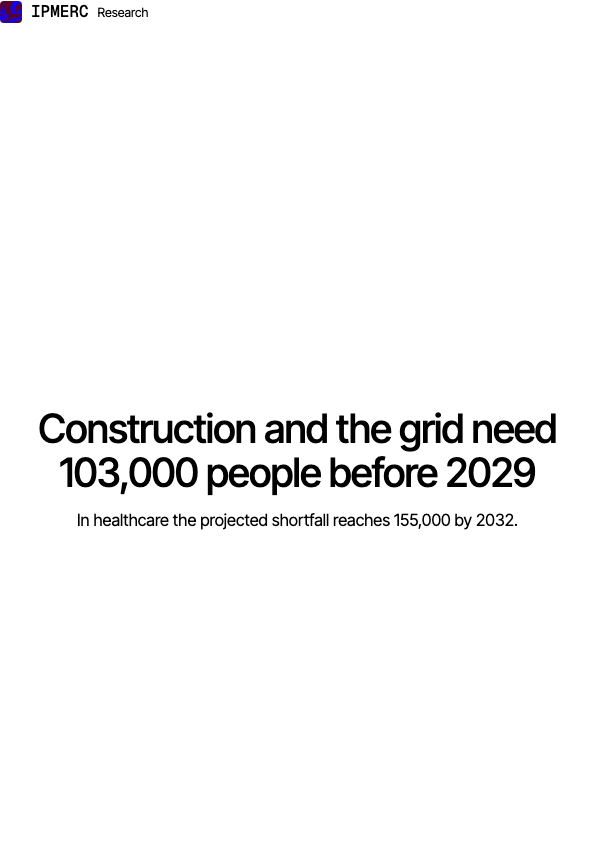
Construction needs 75,000 new full-time workers between 2026 and 2029, of which education can supply roughly 50,000 and 25,000 must come from lateral entry. Grid operators need 28,000 technicians by 2029, 23,000 of them at contractors. Healthcare projects a shortfall of 155,000 by 2032, against 37,000 in 2021. These are the three sectors where the vacancy rate barely fell after 2022.
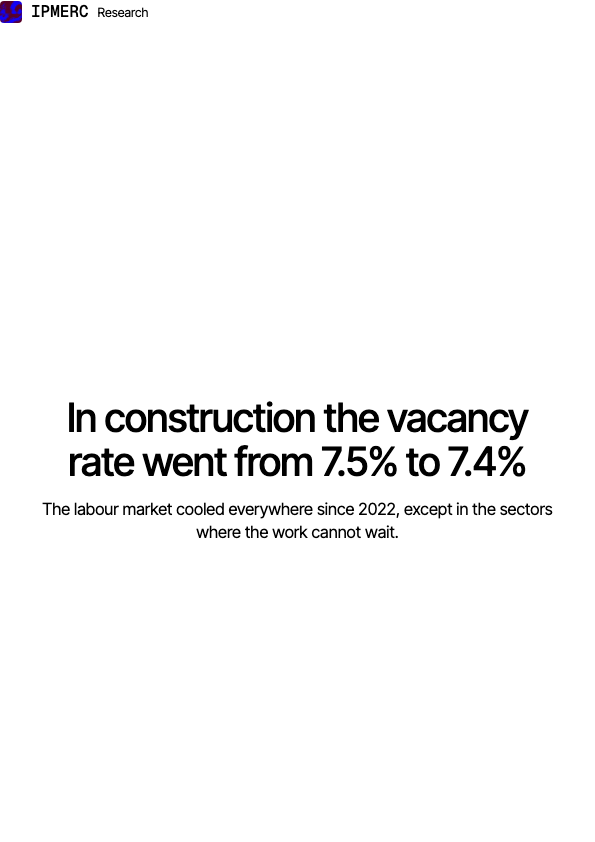
Between mid-2022 and mid-2025 the Dutch vacancy rate fell from 5.1% to 4.2%. That average hides the real story. In ICT the rate dropped from 8.2% to 5.1%, in trade and hospitality from 6.6% to 4.7%. In construction it went from 7.5% to 7.4%, and in healthcare from 4.4% to 4.3%. Two sectors barely cooled at all, and they are exactly the sectors where production cannot be postponed or automated.
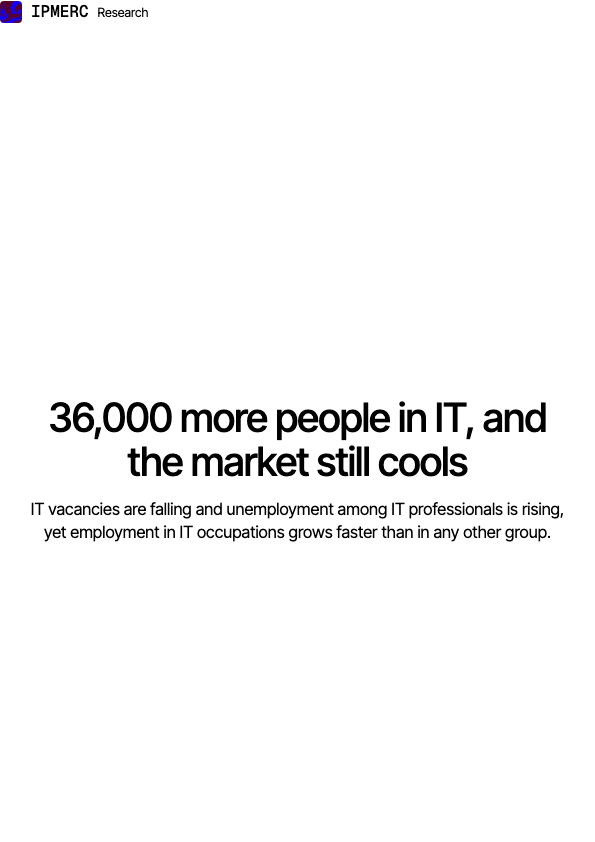
The Dutch IT labour market has been cooling since 2023. Yet employment in IT occupations grew by 36,000 year on year in the second quarter of 2026, the largest increase of any occupational group. Those figures do not contradict each other: the market is normalising after an exceptional peak, but the constraint has moved from volume to fit. In 2024, 63% of companies that tried to recruit IT staff failed to fill every vacancy.
In the fourth quarter of 2024, 34 of the 93 scored Dutch occupation groups were tight and 56 very tight; 2 were average and 1 was loose. For 32 of the 112 groups, ROA forecasts further tightening to 2030. What sets those groups apart is rarely job growth and usually departure: on average 2.8% of workers must be replaced each year, among butchers 8.1%, the highest of all occupation groups, and among advisers in marketing, public relations, and sales 1.1%. Butchers see almost no job growth and stay tight anyway; the advisers ease slightly. Representatives and buyers shrink by 1,900 workers and still stay on the tight side. The three scored ICT groups, together 518,400 workers, were all very tight at the end of 2024 and all ease slightly to 2030; for ICT user support that was already visible in the third quarter of 2025. For five technical occupation groups, the forecast easing was not yet visible in the Spanningsindicator in that same quarter.
In 2024, 71.0% of Dutch enterprises with 10 or more employees bought paid cloud services. In the same year 29.7% of them employed an ICT specialist. By 2025, 55.4% of Dutch enterprises hosted a database or their files with a cloud provider against 24.0% across the European Union, and only Denmark was higher at 55.5%. Migration off those services requires ICT staff. Of the Dutch enterprises that tried to recruit an ICT specialist in 2024, 63.1% were left with a vacancy they could not fill, and the reason cited most often was that nobody applied. When the Netherlands Authority for Consumers and Markets surveyed 420 business cloud users, 172 had at some point tried to switch provider. For 52 of them the attempt failed, which is 30.2% of all attempts. Among those that did switch, 52.5% used an intermediary.
Labour scarcity is no longer a matter of the business cycle. The Dutch central bank concluded in 2024 that an ageing population leaves labour supply barely growing through to 2040. If supply stops growing, demand adapts: firms scale work back, raise its price, or automate it. Business services already shows this. In numbers the gap is nearly closed; in quality it is wide.
When Dutch employers were asked in autumn 2025 to name their hardest vacancy, 27% named a technical occupation: fitters, welders, CNC operators, machinists, and engineers. Care and welfare professions followed at 13%. In construction, 71% of vacancies arising over the past 12 months were hard to fill; in manufacturing, 53%. The vacancy rate in the fourth quarter of 2025 stood at 7.0% in construction, 5.0% in professional and technical services, and 4.8% in ICT, against 3.9% for the economy as a whole. The overall market is loosening, the share of hard-to-fill vacancies fell from 53% in 2023 to 45% in 2025, but that is largely an office-job story. In Germany, the ICT vacancy rate dropped to 2.5%. The Dutch technical shortage is not a European inevitability. It is a Dutch profile.
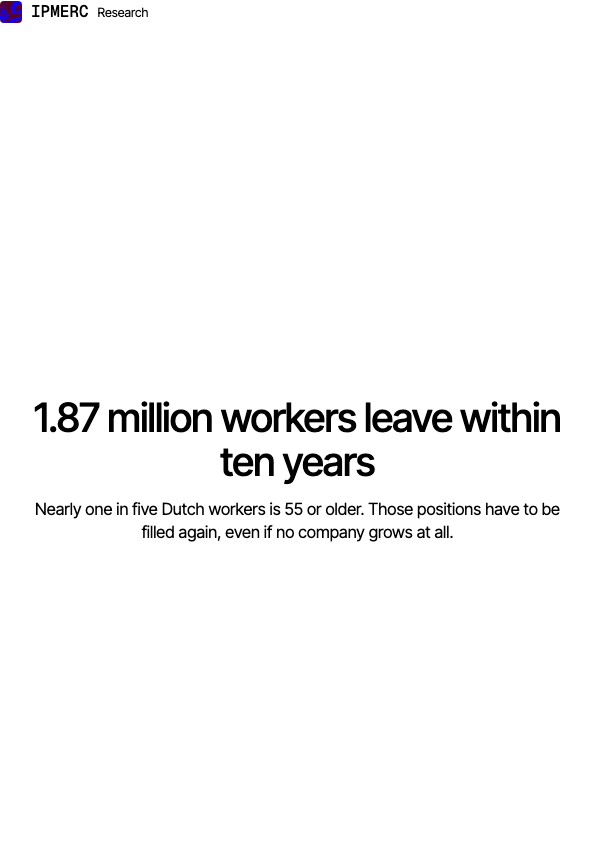
Of the 9.42 million Dutch people working between the ages of 15 and 64, 1.87 million are between 55 and 64: 19.9%. They leave the labour market within roughly ten years. That is not a cycle and not a growth scenario, it is an age structure already fixed. The demand for staff it creates exists regardless of what the economy does, while the inflow meant to absorb it is smaller than the outflow.
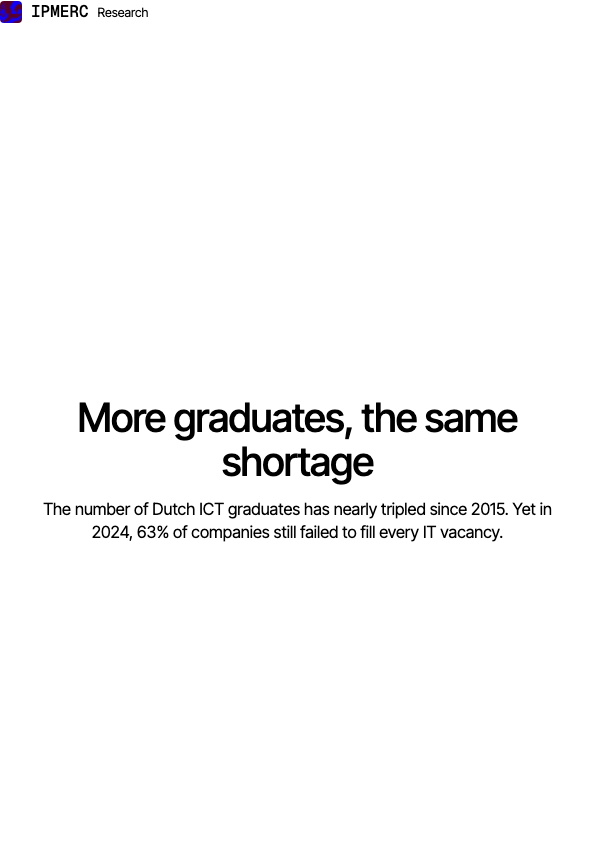
The Netherlands produced 8,710 ICT graduates at bachelor and master level in 2024, against 3,101 in 2015. That is a rise of 181% in nine years, far faster than the 28% growth in total graduates. Yet the share of companies with hard-to-fill IT vacancies stayed around 63%. More supply from education has not resolved the shortage, and this report sets out why.
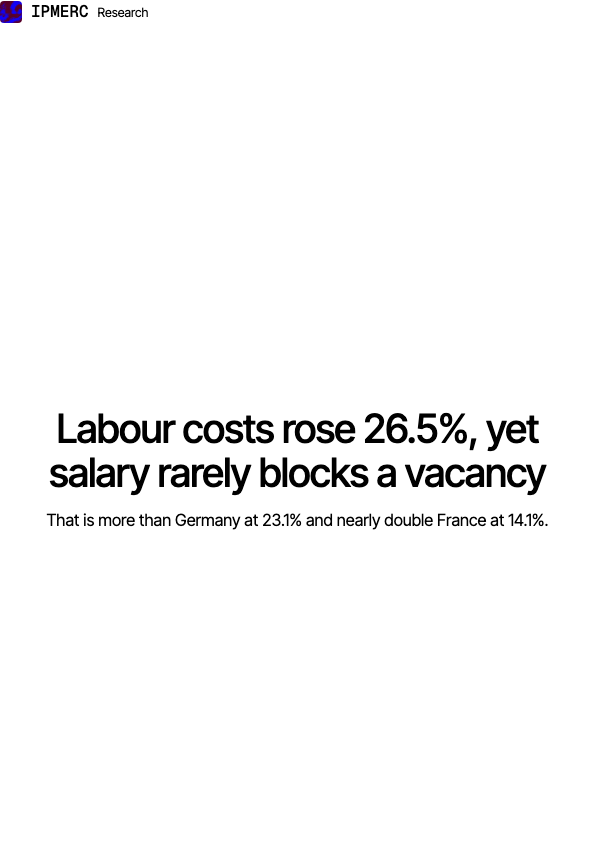
The Dutch labour cost index went from 113.1 to 143.1 between mid-2021 and mid-2025, a rise of 26.5%. That is more than Germany at 23.1% and nearly double France at 14.1%. Yet only 39% of Dutch employers name candidate salary expectations as a reason an IT vacancy is hard to fill, below the EU average of 42%. Together those facts mean paying more does not fix a matching problem.
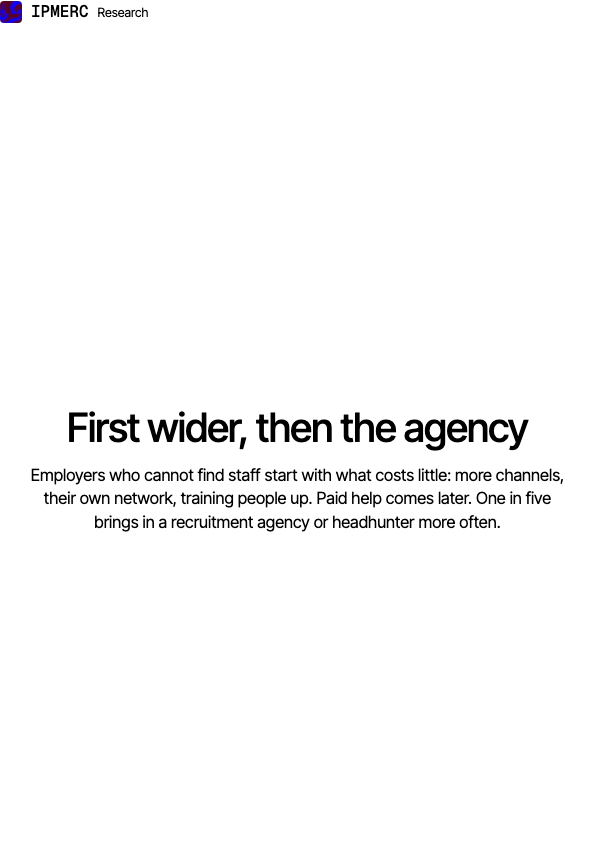
Of Dutch employers with external vacancies, 65% made extra recruitment efforts in autumn 2025 because of labour market tightness. The order forms a ladder. At the top sit the cheap rungs: spreading vacancies across more channels (54%), recruiting through the employer's own network (52%), and hiring candidates who still need training (52%). Better terms of employment follow at 34%. Only then comes the outside door: 22% hired more temporary, seconded, or freelance staff, and 21% deployed a recruiter, recruitment agency, or headhunter more often. In manufacturing, both external routes sit above average. At the peak of the shortage, in autumn 2021, half of employers with hard-to-fill vacancies engaged a temp agency, recruitment agency, or headhunter. An agency that wins a mandate therefore receives, on average, a vacancy the market has already rejected: 87% of employers with recruitment problems reported too few applications.
A Dutch recruitment agency typically charges 22 to 32% of gross annual salary per placement on a contingency basis; retained search runs at 20 to 30%, with part of the fee paid up front. On a €55,000 salary at a 25% fee that is €13,750. An in-house corporate recruiter costs €65,000 to €80,000 a year, built from an average salary of roughly €41,000 to €55,000 (consulted August 2026), about 30% in employer charges, and several thousand euros in systems and job boards. That fixed cost only pays for itself from about five to seven placements a year that would otherwise have gone through an agency. Above that volume the in-house recruiter wins comfortably: the most recent Dutch benchmark (measured in 2020) put corporate cost per hire at €3,818, with recruiters carrying an average portfolio of 20 vacancies. Below that volume, a company pays more for its own recruiter than it would have paid in fees. And for scarce technical profiles the most expensive outcome looms: months of internal effort first, then the agency fee anyway.