We use only the cookies needed to run the site and keep you signed in. No analytics, no advertising. Your answer covers anything optional we add later.
Between mid-2022 and mid-2025 the Dutch vacancy rate fell from 5.1% to 4.2%. That average hides the real story. In ICT the rate dropped from 8.2% to 5.1%, in trade and hospitality from 6.6% to 4.7%. In construction it went from 7.5% to 7.4%, and in healthcare from 4.4% to 4.3%. Two sectors barely cooled at all, and they are exactly the sectors where production cannot be postponed or automated.
The Netherlands produced 8,710 ICT graduates at bachelor and master level in 2024, against 3,101 in 2015. That is a rise of 181% in nine years, far faster than the 28% growth in total graduates. Yet the share of companies with hard-to-fill IT vacancies stayed around 63%. More supply from education has not resolved the shortage, and this report sets out why.
The Dutch IT labour market has been cooling since 2023. Yet employment in IT occupations grew by 36,000 year on year in the second quarter of 2026, the largest increase of any occupational group. Those figures do not contradict each other: the market is normalising after an exceptional peak, but the constraint has moved from volume to fit. In 2024, 63% of companies that tried to recruit IT staff failed to fill every vacancy.
In 2024, 71.0% of Dutch enterprises with 10 or more employees bought paid cloud services. In the same year 29.7% of them employed an ICT specialist. By 2025, 55.4% of Dutch enterprises hosted a database or their files with a cloud provider against 24.0% across the European Union, and only Denmark was higher at 55.5%. Migration off those services requires ICT staff. Of the Dutch enterprises that tried to recruit an ICT specialist in 2024, 63.1% were left with a vacancy they could not fill, and the reason cited most often was that nobody applied. When the Netherlands Authority for Consumers and Markets surveyed 420 business cloud users, 172 had at some point tried to switch provider. For 52 of them the attempt failed, which is 30.2% of all attempts. Among those that did switch, 52.5% used an intermediary.
When Dutch employers were asked in autumn 2025 to name their hardest vacancy, 27% named a technical occupation: fitters, welders, CNC operators, machinists, and engineers. Care and welfare professions followed at 13%. In construction, 71% of vacancies arising over the past 12 months were hard to fill; in manufacturing, 53%. The vacancy rate in the fourth quarter of 2025 stood at 7.0% in construction, 5.0% in professional and technical services, and 4.8% in ICT, against 3.9% for the economy as a whole. The overall market is loosening, the share of hard-to-fill vacancies fell from 53% in 2023 to 45% in 2025, but that is largely an office-job story. In Germany, the ICT vacancy rate dropped to 2.5%. The Dutch technical shortage is not a European inevitability. It is a Dutch profile.
Of Dutch employers with external vacancies, 65% made extra recruitment efforts in autumn 2025 because of labour market tightness. The order forms a ladder. At the top sit the cheap rungs: spreading vacancies across more channels (54%), recruiting through the employer's own network (52%), and hiring candidates who still need training (52%). Better terms of employment follow at 34%. Only then comes the outside door: 22% hired more temporary, seconded, or freelance staff, and 21% deployed a recruiter, recruitment agency, or headhunter more often. In manufacturing, both external routes sit above average. At the peak of the shortage, in autumn 2021, half of employers with hard-to-fill vacancies engaged a temp agency, recruitment agency, or headhunter. An agency that wins a mandate therefore receives, on average, a vacancy the market has already rejected: 87% of employers with recruitment problems reported too few applications.
The Dutch economy runs on technology, but its working population is thinly educated in it. In 2025, 9.0% of employed people held a completed tertiary degree in the STEM fields of science, engineering or ICT, against 11.1% on average in the EU. That puts the Netherlands 22nd of the 30 measured countries; Lithuania leads with 15.1%. The stock is growing, from 748,700 workers in 2021 to 869,500 in 2025, a rise of 16%. Of them, 65% work as professionals and some 12% outside the knowledge occupations.
While the IT vacancy rate fell sharply after 2022, the business register kept moving the other way: from 92,620 ICT enterprises in 2021 to 111,713 in 2024, growth of 21% in three years. Employment in the sector grew along to 386,306 people in 2023, 8% more than in 2021, at fewer than four people per enterprise. The sector stands at 3.8% of Dutch employment, against 3.4% on average in the EU, and 5.3% of value added. The growth sits mostly in very small firms, and that is the real finding.
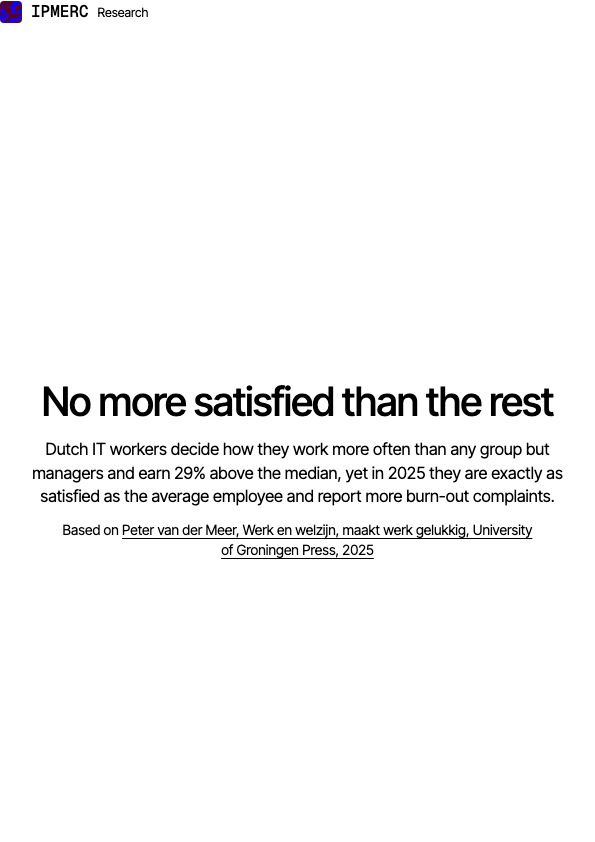
In 2025, 78.7% of Dutch employees in ICT occupations say they are satisfied with their work, against 78.6% of all employees. In 2018 IT led by 4.4 points. That lead is gone while the lead in freedom and pay stayed: 79.8% of IT workers regularly decide how they do their work, against 60.2% of all employees, and the median hourly wage is €34.80 against €26.90. Burn-out complaints run ahead instead, at 24.1% against 20.7%. This paper sets the figures of the Dutch working conditions survey beside the model of labour economist Peter van der Meer, which explains why pay and autonomy do not carry wellbeing at work on their own, and what that means for anyone recruiting IT staff.