We use only the cookies needed to run the site and keep you signed in. No analytics, no advertising. Your answer covers anything optional we add later.
In 2024, 71.0% of Dutch enterprises with 10 or more employees bought paid cloud services. In the same year 29.7% of them employed an ICT specialist. By 2025, 55.4% of Dutch enterprises hosted a database or their files with a cloud provider against 24.0% across the European Union, and only Denmark was higher at 55.5%. Migration off those services requires ICT staff. Of the Dutch enterprises that tried to recruit an ICT specialist in 2024, 63.1% were left with a vacancy they could not fill, and the reason cited most often was that nobody applied. When the Netherlands Authority for Consumers and Markets surveyed 420 business cloud users, 172 had at some point tried to switch provider. For 52 of them the attempt failed, which is 30.2% of all attempts. Among those that did switch, 52.5% used an intermediary.
Every quarter, hundreds of thousands of Dutch employees start work for a new employer. In the second quarter of 2026 the count was 320,000, or 4.0% of all employees, roughly one in 25. Since 2013 the quarterly rate has moved between 2.6% and 5.3%, and the tight-market peak has fully unwound: the current pace sits almost exactly on the 2019 level. The flow is carried by the flexible layer: more than six in ten switchers leave a flexible contract, and 85% start on one again after the move.
Of Dutch employers with external vacancies, 65% made extra recruitment efforts in autumn 2025 because of labour market tightness. The order forms a ladder. At the top sit the cheap rungs: spreading vacancies across more channels (54%), recruiting through the employer's own network (52%), and hiring candidates who still need training (52%). Better terms of employment follow at 34%. Only then comes the outside door: 22% hired more temporary, seconded, or freelance staff, and 21% deployed a recruiter, recruitment agency, or headhunter more often. In manufacturing, both external routes sit above average. At the peak of the shortage, in autumn 2021, half of employers with hard-to-fill vacancies engaged a temp agency, recruitment agency, or headhunter. An agency that wins a mandate therefore receives, on average, a vacancy the market has already rejected: 87% of employers with recruitment problems reported too few applications.
A Dutch recruitment agency typically charges 22 to 32% of gross annual salary per placement on a contingency basis; retained search runs at 20 to 30%, with part of the fee paid up front. On a €55,000 salary at a 25% fee that is €13,750. An in-house corporate recruiter costs €65,000 to €80,000 a year, built from an average salary of roughly €41,000 to €55,000 (consulted August 2026), about 30% in employer charges, and several thousand euros in systems and job boards. That fixed cost only pays for itself from about five to seven placements a year that would otherwise have gone through an agency. Above that volume the in-house recruiter wins comfortably: the most recent Dutch benchmark (measured in 2020) put corporate cost per hire at €3,818, with recruiters carrying an average portfolio of 20 vacancies. Below that volume, a company pays more for its own recruiter than it would have paid in fees. And for scarce technical profiles the most expensive outcome looms: months of internal effort first, then the agency fee anyway.
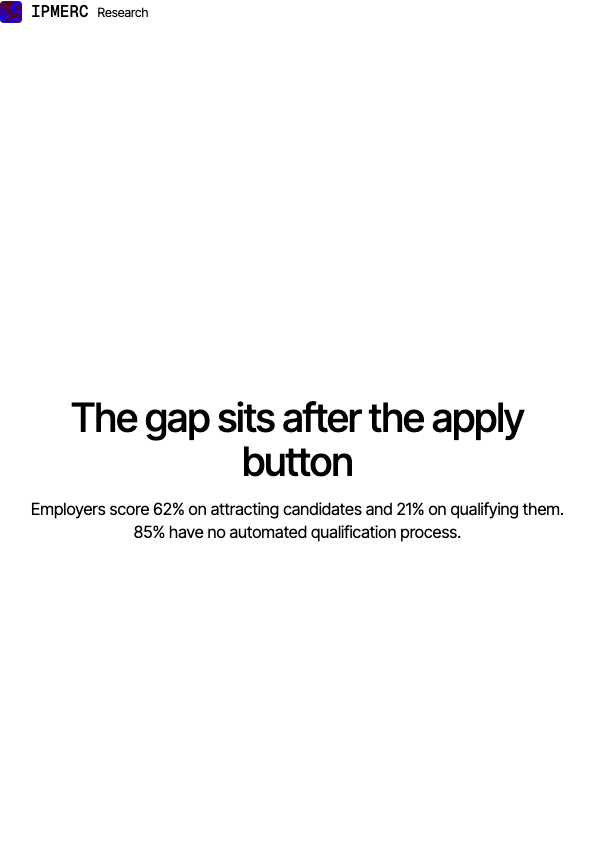
In 2026, platform vendor Phenom audited 219 employers across eight industries on the automation of their hiring process. On attracting, engaging, and converting candidates, employers average 62% of the attainable maximum. On qualification after the apply click, the same employers average 21%, a gap of 41 percentage points. 94% do not schedule an interview at the point of application. 99% do not use video interviews inline. Less than 1% have a fully orchestrated qualification process. For frontline roles, 85% sit in the lowest automation tier. For knowledge worker roles the figure is 93%. No industry scores above 30%. The data comes from a platform vendor measuring against its own product categories, and that caveat applies to every use of the figures.
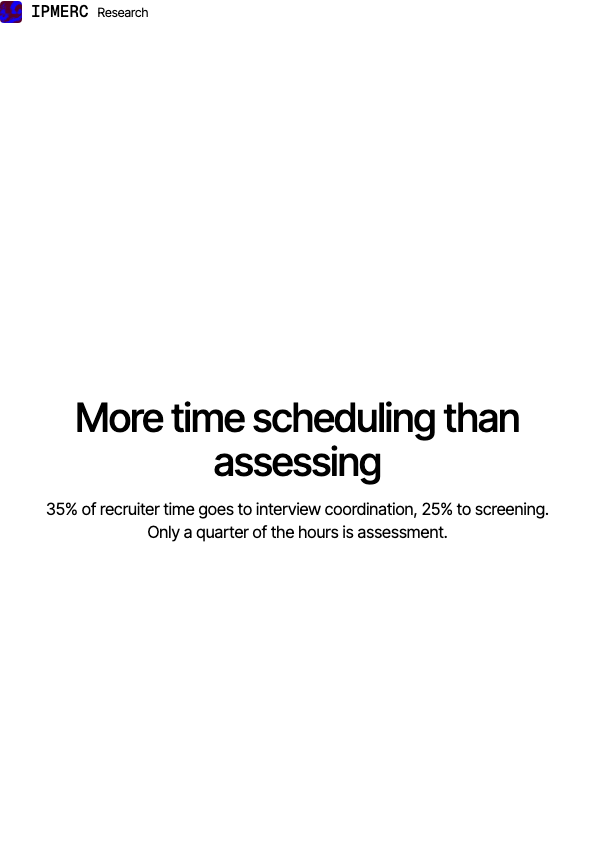
A 2026 survey of more than a hundred organisations by Aptitude Research shows that 35% of recruiter time goes to interview coordination, 25% to screening, and 24% to candidate communication. Of the 219 employers Phenom audited, 94% do not offer automated interview scheduling at the point of application. 6% do. 1% deploy a voice screening agent. 57% of surveyed organisations already use some form of automation agent, but adoption clusters at the front of the process, not at the coordination steps that consume the largest share of hours.
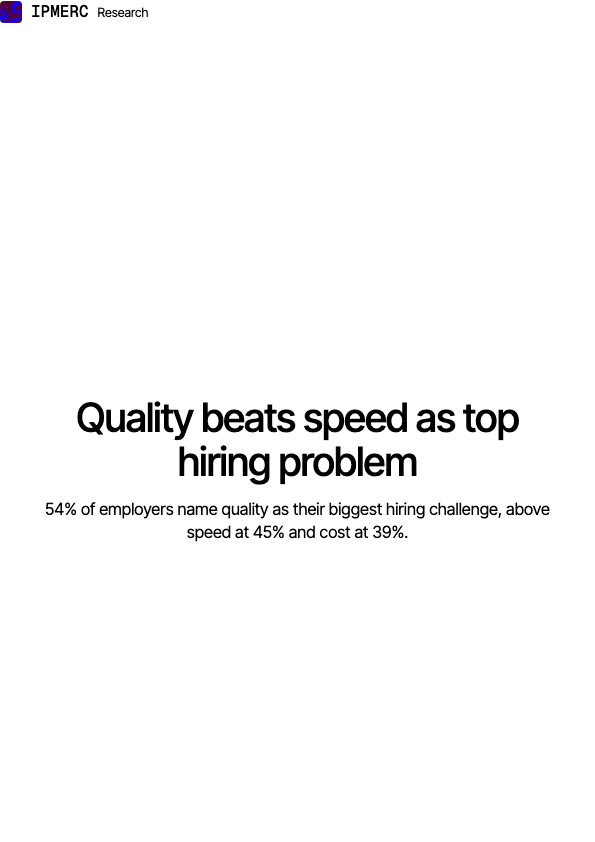
A 2026 survey of more than a hundred organisations by Aptitude Research shows that 54% name quality as the biggest hiring challenge. 45% name speed and 39% name cost. Among employers that rate their automation as effective, 42% report higher quality of hire. But 61% of the 219 audited employers apply the same automation to frontline and knowledge worker roles, with no distinction by profile type. 64% measure automation usage well, but only 60% do so consistently across role types. The shift from speed to quality changes what a client expects from an agency.
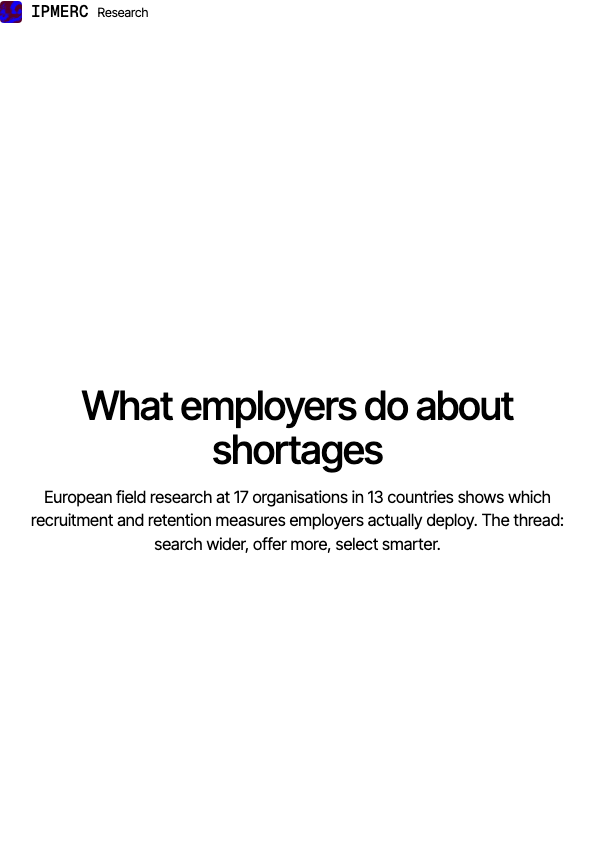
While 77% of European employers already struggled in 2019 to find people with the right skills, good documentation of what firms actually do about it is scarce. The European foundation for working conditions studied it at 17 organisations across 13 member states. The measures cluster in four groups: partnering with education and intermediaries, offering more than pay, recruiting smarter through referrals and wider catchment areas, and selecting on aptitude rather than diplomas. The most striking finding: the will to recruit internationally exceeds its use.
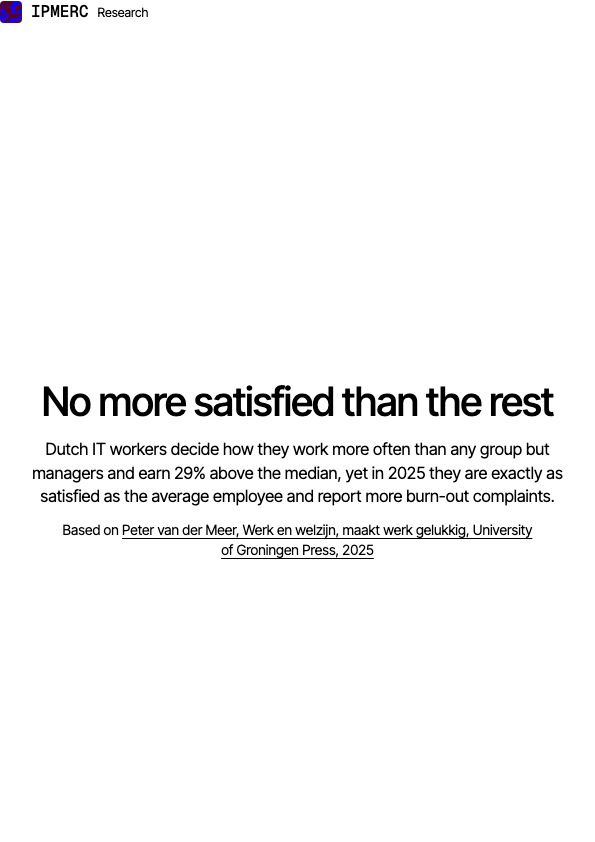
In 2025, 78.7% of Dutch employees in ICT occupations say they are satisfied with their work, against 78.6% of all employees. In 2018 IT led by 4.4 points. That lead is gone while the lead in freedom and pay stayed: 79.8% of IT workers regularly decide how they do their work, against 60.2% of all employees, and the median hourly wage is €34.80 against €26.90. Burn-out complaints run ahead instead, at 24.1% against 20.7%. This paper sets the figures of the Dutch working conditions survey beside the model of labour economist Peter van der Meer, which explains why pay and autonomy do not carry wellbeing at work on their own, and what that means for anyone recruiting IT staff.
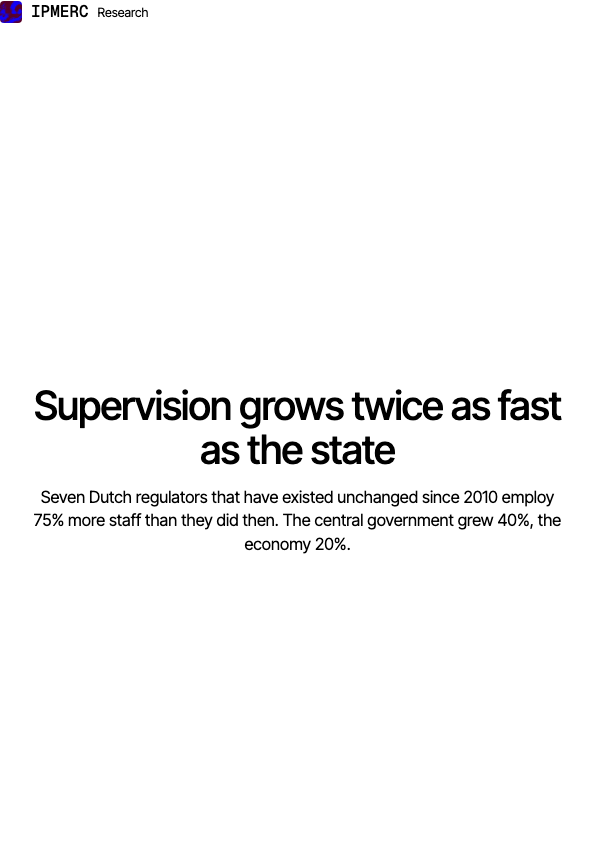
Seven Dutch regulators that have kept the same form since 2010 grew from 2,730 to 4,772 full-time staff, a rise of 75%. The data protection authority went from 79 to 312, the mines inspectorate from 57 to 188, the healthcare authority from 254 to 521. The financial markets regulator AFM grew 70% and the central bank DNB 54%. The central government as a whole employed 160,016 full-time staff at the end of 2025 against 114,328 at the end of 2010, up 40.0%. The whole Dutch economy grew 19.6% in full-time years over the same period. Inside the central government, inspection work grew 33.5% between 2021 and 2025, against 22.0% for all staff. The growth tracks new legal duties: the GDPR in 2018, online gambling in 2021, the Groningen earthquakes, and new European financial rules. The Jetten cabinet books €1.4bn of savings on the government apparatus in 2030. The CPB, the government's own forecaster, counts €0.2bn of it and calls the rest implausible while no tasks are dropped. Growth already stalled in 2025: the competition authority shrank, the health inspectorate shrank, the healthcare authority stood still, and the central government added 1.9%.